SATELLITE IMAGES AND RADAR
INTRODUCTION
Meteo Maarssen has not a 24/7 operation service. Any service may interrupted without any notice. Updates on this page are on usual on 18:00 CET, but there might be some delays.
Material on the page is protected by copyright: Meteosat images (Eumetsat); NOAA (NOAA); Weather radar (KNMI/Meteox/Buienradar): See the notices on the disclaimer.
MORE INFORMATION :
Earth at Large (Ferdinand Valk)
Software from David Taylor (processing satellite images)
Software from WeatherGraphics (processing weathermaps)
Feel free to send comments about this page Meteo Maarssen (Ton Lindemann).
COLOR LINE FOR INFRARED IMAGES
NORTH ATLANTIC OCEAN AND EUROPE
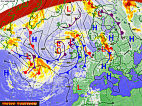
The Meteosat 8 images are displayed with a weather map and fronts: Warm front, Cold front, Occlusion, Stationary front, trough: black in IR and green in VIS.
INFRARED 00 UTC
Images taken in the infrared channel and displayed with a color code. Cold cloud tops are pink and red, fading to yellow and gray for warmer cloud tops Cold cloud stops are often boundaries from air masses near fronts and can produce precipitation. Use the color bar to find the temperatures of the clouds.
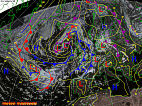
VISUAL 12 UTC
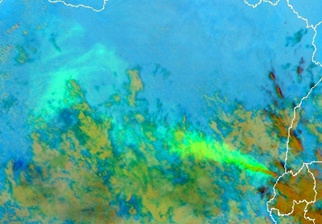
A false color composite from the visual and thermal channel. Pink are cold ice clouds and the yellow/greenish clouds are water clouds near the surface.
 |
 |
|
|
WORLD WEATHER ATLAS
No updates until further notice

Composite of Goes 11, 12, Meteosat 9, Meteosat 7 and MTSat
Click on the image for a larger format.
The World weather atlas is a worldwide overview in infrared from satellite images. Images form all geostationary satellite are merged to a full map for each continent or oceanic region. All infrared imaged are colored to spot the cold cloud tops, frontal boundaries, cyclones or thunderstorms. Each image is completed with a real weather map to determinate high's and lows.
HURRICAN WATCH
No updates until further notice
Infrared satellite images from van 12 UTC with weather maps for all regions where cyclones exists.
SEA-ICE AND SEAWATER TEMPERATURES
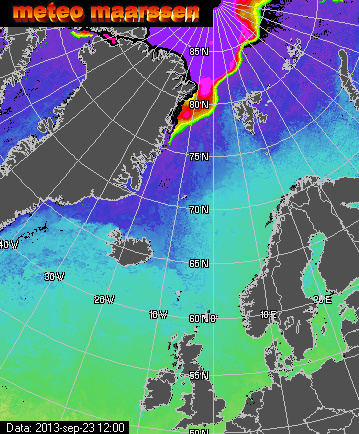 |
The map left shows the sea ice distribution of of the Nor-thern Atlantic and the seawa-ter temperatures of the waters in the Northern Atlantic Ocean.
|
RADAR
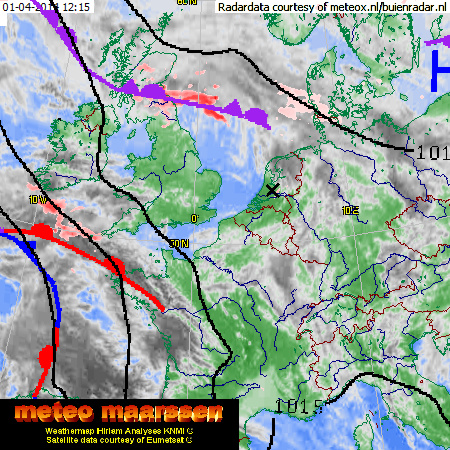
WEST EUROPEAN RADAR
|
This Euroradar image is a merged composite taken from national weather services from countries in Western Europe: United Kingdom/ Ireland, France, Belgium, Netherlands, Germa-ny, Denmark, Norway and Sweden. The final result is published on a Meteosat 8/9 infrared frame. Precipitation intensity is given in shades of red. Light red correspondences with light precipitation, and dark red to brown with heavy precipitation. Be warned that radar may give some false signal in some cases. Then you will see some precipitation on clear skies. We can't prevent this.
|
EUROPEAN RADAR
The European rainradar is a composition of radarimages of Norway. Sweden, Fuinland, Denmark, Ireland, Great Brittan, Benelux, Germany, Poland, France, Swiss, Portugal, Spain and Italy. Radar images are plotted on a satellite image from Meteosat and there is one frame per hour. Images can´t processed in real time. Images are delayed for at least 24 hour. An update can be exspected every evening with yesterdays radar images. |
|
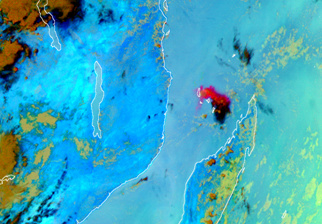
VOLCANIC ERUPTIONS
This section is not intended to be used as actual information for aviation. Please refer to the most recent sigmets available at your meteorological aviation services.
The map below shows all regions with active volcanoes within the field of view from Meteosat 8 and 9. You will get and map from all active volcanoes for a region by clicking on the number at the globe. This number correspondences with the region list at the right side of the globe. Any image or animation from an eruption is stored in our online archive. This service is started at 1 January 2008.
Volcanoes on the map below and satellite images are flagged as:
* eruptions from 1801 - 2000
^ eruptions from 2001 - present
Only large eruptions and only when not covered by clouds are visible on the (weather/remote sensing) satellite images. And only this eruptions are available on this site. The reports from the VAAC's (Volcanic Ash Advisory Centers) are used for monitoring the volcanoes. VAAC's for the Meteosat field of view are located at London and Toulouse for Europe, Africa and the Middle East, Washington for the Lesser Antilles and Buenos Aires for the Southwestern Atlantic Ocean.
Listed are images from the Aura/OMI, Modis, Meteosat, NOAA and Metop satellites.
| Examples from volcanic eruptions | |
 |
 |
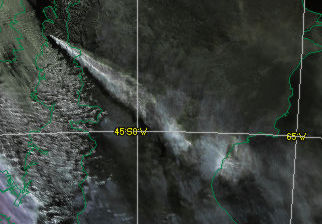
| Ashclouds from the Karthala during the 25 November 2005 eruption (Meteosat). |
Sulferdioxide clouds from the Nyiragongo during the 28 november 2006 eruption (Meteosat). |
 |
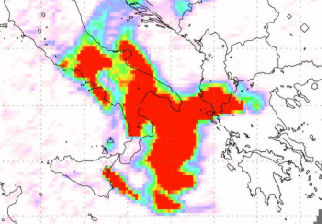 |
| Ashclouds from the Chaiten during the 3 may 2008 eruption (Metop 2) | Sulferdioxide clouds from the Etna during the 14 may 2008 eruprion (Aura/OMI). |
Click on the number above for an overview of the active volcanoes in the corresponding region. |
Regions with active volcanoes
(most active regions are printed bold): |
|
1 |
Atlantic Ocean-Central |
|
| ir infrared | fc false colors | vis visual | an*3 animation in n-days |
| OMI measures SO2 | cm cloud mask |
Imagery from volcanic eruptions are in general daily updated. Take a look on our archive for older images from earlier eruptions since 2008.
El Hierro - Canary Isles
Etna - Italy
Jebel Zubair - Yemen
Nyamuragira - Zaire